Blood Sugar Conversion Chart: How to Understand Your Glucose Numbers in Different Units
Table of Contents
- Why Blood Sugar Units Can Be Confusing
- What Is a Blood Sugar Conversion Chart?
- Blood Sugar Conversion Chart: mg/dL to mmol/L
- How to Convert Blood Sugar Readings Yourself
- Real-Life Situations Where Conversion Helps
- What a Conversion Chart Can and Cannot Tell You
- Common Mistakes When Converting Blood Sugar Numbers
- A Practical Framework: The C.L.E.A.R. Method
- Simple Example: Turning Numbers Into Useful Information
- When to Talk to a Healthcare Professional
- Practical Takeaway
- FAQ
- What is a blood sugar conversion chart?
- How do I convert blood sugar from mg/dL to mmol/L?
- How do I convert blood sugar from mmol/L to mg/dL?
- Is 100 mg/dL the same as 5.6 mmol/L?
- What is 7.0 mmol/L in mg/dL?
- Why do different countries use different blood sugar units?
- Are converted blood sugar numbers exact?
- Can I use this chart for fasting and after-meal readings?
- Can a blood sugar conversion chart tell me if I have diabetes?
- Should I change my diet or medication based on a converted number?
- References & Further Reading
Blood sugar numbers can be confusing enough on their own. They become even more confusing when one website shows a reading in mg/dL, your glucose meter uses mmol/L, or a lab report lists a number that looks completely unfamiliar.
For example, you may see 100 mg/dL in one article and 5.6 mmol/L in another. At first glance, they look like very different readings. In reality, they are roughly the same glucose value shown in two different measurement units.
That is where a blood sugar conversion chart can help. It does not diagnose diabetes, explain every high or low reading, or replace medical advice. But it can help you translate glucose numbers from one unit to another so you can read articles, compare logs, and understand your own records more clearly.
This guide explains how to convert blood sugar readings between mg/dL and mmol/L, how to use a conversion chart in real life, and what mistakes to avoid when tracking your numbers.
Health disclaimer: This article is for general educational purposes only. It is not medical advice, diagnosis, or treatment guidance. If you are concerned about your blood sugar readings, symptoms, medications, or test results, speak with a qualified healthcare professional.
Why Blood Sugar Units Can Be Confusing
Blood sugar is usually measured in one of two units:
- mg/dL, which means milligrams per deciliter
- mmol/L, which means millimoles per liter
The number may look very different depending on the unit used.
For example:
- 90 mg/dL is about 5 mmol/L
- 126 mg/dL is about 7 mmol/L
- 180 mg/dL is about 10 mmol/L
So when someone says their blood sugar is “7,” that could mean something very different depending on the unit. 7 mmol/L is about 126 mg/dL, while 7 mg/dL would be extremely low and not fall within the normal blood sugar range chart.
This is why labeling the unit matters. A number without a unit cn easily be misunderstood.
What Is a Blood Sugar Conversion Chart?
A blood sugar conversion chart is a simple reference table that shows the same glucose value in both common units: mg/dL and mmol/L.
It is useful when:
- Your glucose meter uses one unit, but an article uses another
- You are comparing lab results with home readings
- You are reading health information from another country
- You are using an app or logbook that asks for a different unit
- You are discussing blood sugar with someone who uses a different measurement system
The chart helps with translation. It does not tell the full story of your health.
Blood Sugar Conversion Chart: mg/dL to mmol/L
Here is a simple chart with common blood sugar values. The mmol/L values are rounded to one decimal place for everyday use.
Blood Sugar in mg/dL | Blood Sugar in mmol/L |
70 | 3.9 |
80 | 4.4 |
90 | 5.0 |
100 | 5.6 |
110 | 6.1 |
120 | 6.7 |
126 | 7.0 |
140 | 7.8 |
160 | 8.9 |
180 | 10.0 |
200 | 11.1 |
250 | 13.9 |
300 | 16.7 |
You can bookmark this chart or use it when entering numbers into a blood sugar log.
How to Convert Blood Sugar Readings Yourself
You do not always need a chart. Once you know the basic formula, conversion becomes simple.
To Convert mg/dL to mmol/L
Use this formula:
mg/dL ÷ 18 = mmol/L
Example:
108 mg/dL ÷ 18 = 6.0 mmol/L
So, if your glucose meter shows 108 mg/dL, that is about 6.0 mmol/L.
To Convert mmol/L to mg/dL
Use this formula:
mmol/L × 18 = mg/dL
Example:
7.0 mmol/L × 18 = 126 mg/dL
So, if a lab report or article shows 7.0 mmol/L, that is about 126 mg/dL.
The Simple Rule to Remember
The key number is 18.
- To go from mg/dL to mmol/L, divide by 18.
- To go from mmol/L to mg/dL, multiply by 18.
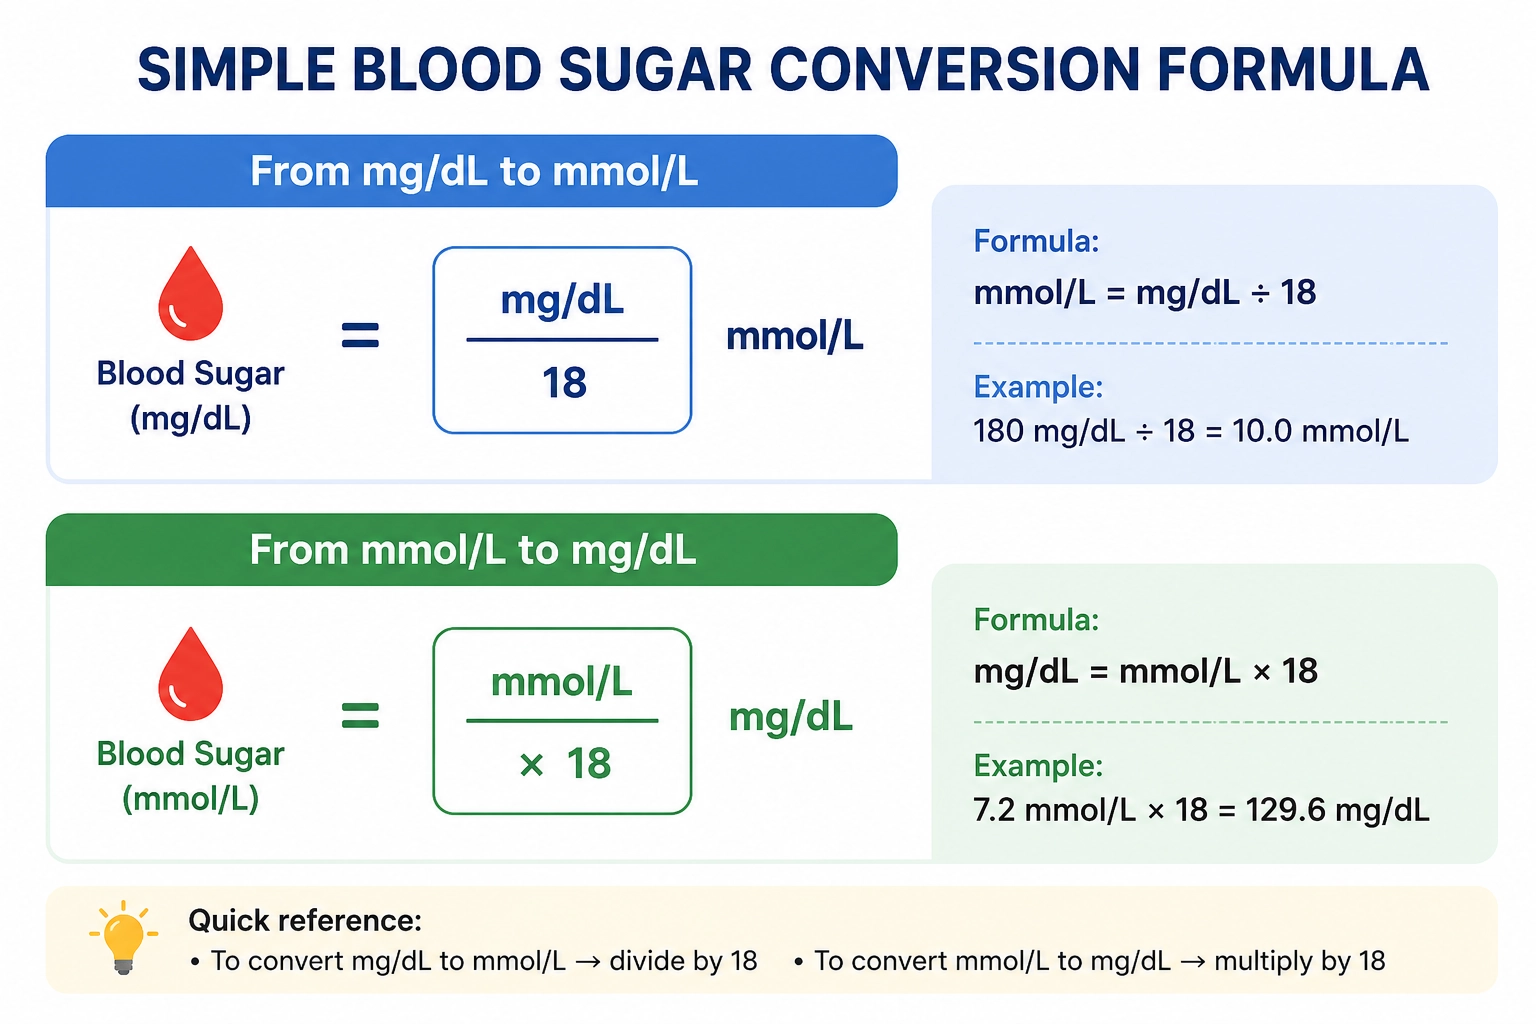
For everyday tracking, rounded numbers are usually easier to read. For example, 5.55 mmol/L is commonly rounded to 5.6 mmol/L.
Real-Life Situations Where Conversion Helps
A conversion chart may seem like a small tool, but it can prevent a lot of confusion in daily life.
Reading an Article from Another Country
Imagine you live in the United States and your glucose meter shows blood sugar in mg/dL. Then you read an article from the UK or Australia that mentions a post-meal reading of 7.8 mmol/L.
Without conversion, that number may not mean much to you. But when you multiply by 18, you get:
7.8 mmol/L × 18 = 140 mg/dL
Now the number becomes easier to compare with the readings you are used to seeing.
Comparing a Lab Report and a Home Glucose Meter
Some people receive lab results in one unit but use a home glucose meter that shows another. This can make the numbers feel unrelated.
For example, your lab report may show 6.1 mmol/L, while your meter history uses mg/dL. Using the formula:
6.1 × 18 = 109.8 mg/dL
So 6.1 mmol/L is about 110 mg/dL.
That does not automatically explain whether the result is good, bad, expected, or concerning. But it helps you understand the number in a familiar unit.
Talking With a Family Member in Another Country
Suppose you talk with a relative who says, “My fasting glucose was 6.5.” If they use mmol/L, that is about:
6.5 × 18 = 117 mg/dL
But if you assume they mean mg/dL, the number would sound completely different. This is why it is helpful to ask, “Is that mmol/L or mg/dL?”
Using a Blood Sugar Log
If you track your readings, mixing units can create confusion later.
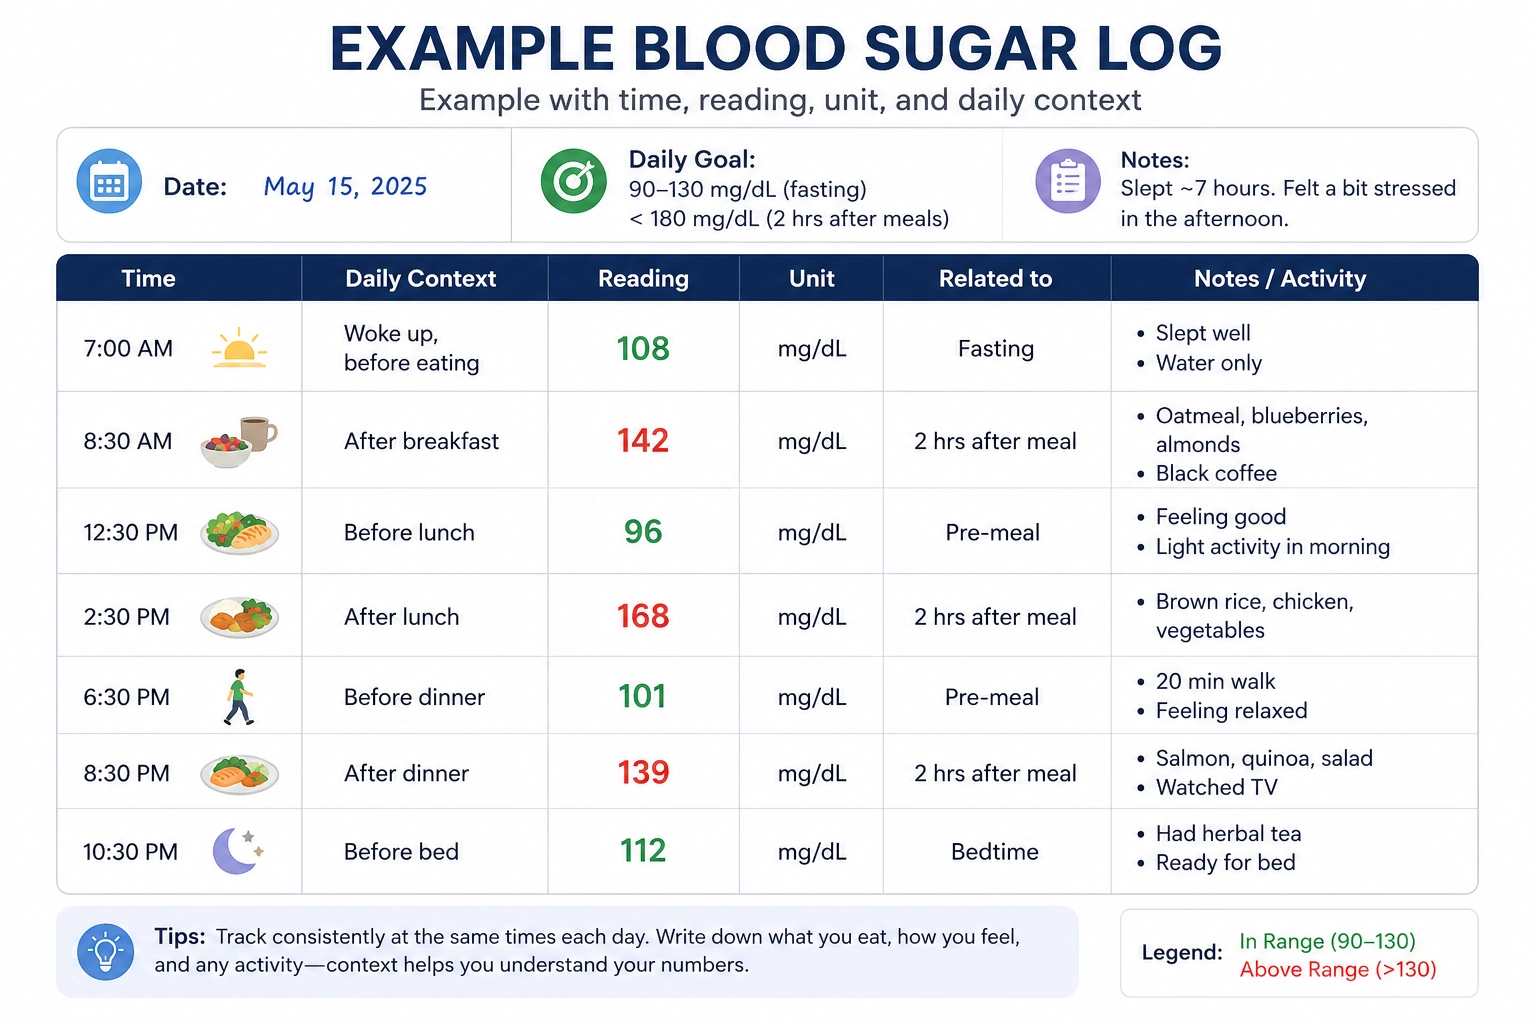
This log is understandable because the unit is clearly labeled. Without the unit, the number 6.4 could be misread later.
If possible, choose one unit for your main log, and learn how to use a blood sugar log without feeling overwhelmed to stay consistent.
What a Conversion Chart Can and Cannot Tell You
A blood sugar conversion chart is useful, but it has limits.
It Can Help You Understand the Unit
The chart can help you translate a number from one system to another. This is helpful when reading articles, comparing logs, or checking app settings.
It Cannot Diagnose Diabetes
A conversion chart cannot tell you whether you have diabetes, prediabetes, insulin resistance, or any other medical condition.
Diagnosis usually depends on specific lab tests, timing, symptoms, medical history, and professional interpretation. A home reading can be useful information, but it should not be treated as a diagnosis by itself.
It Does Not Explain Why a Reading Is High or Low
Blood sugar can be affected by many factors, including:
- What and how much you ate
- Time since your last meal
- Sleep quality
- Stress
- Physical activity
- Illness
- Hydration
- Medications
- Testing method
- Meter accuracy
A conversion chart translates the number. It does not explain the cause behind the number.
Common Mistakes When Converting Blood Sugar Numbers
Mistake 1: Mixing Up mg/dL and mmol/L
This is the biggest mistake.
A reading of 7.0 mmol/L is about 126 mg/dL. But 7.0 mg/dL is not the same thing at all.
Always check the unit before interpreting the number.
Mistake 2: Forgetting That Converted Numbers Are Rounded
Different charts may show slightly different results because they round numbers differently.
For example:
100 mg/dL ÷ 18 = 5.55 mmol/L
One chart may show 5.5, while another shows 5.6. This small difference usually comes from rounding.
Mistake 3: Comparing Readings Taken at Different Times
A fasting reading and a post-meal reading should not be compared as if they mean the same thing.
For example, a reading taken first thing in the morning before food has a different context from a reading taken one or two hours after a meal.
When tracking blood sugar, timing matters.
Mistake 4: Panicking Over One Unusual Reading
A sudden blood sugar spike or lower-than-usual reading can feel stressful, especially if you are new to monitoring.
But a single number does not always tell the full story. Some people may find it more useful to look for patterns over several days or weeks, especially when they record food, timing, sleep, stress, and activity.
That said, very high or very low readings, repeated unusual readings, or symptoms should be discussed with a healthcare professional.
Mistake 5: Changing Medication or Diet Based Only on a Chart
A conversion chart is not a treatment plan.
It should not be used to change medication, stop medication, diagnose yourself, or make extreme diet changes. If you use insulin or glucose-lowering medication, professional guidance is especially important.
A Practical Framework: The C.L.E.A.R. Method
To make blood sugar tracking more useful, do not only write down the number. Use the C.L.E.A.R. method.
C — Convert the Number
Use the chart or formula if the reading is in a unit you do not normally use.
Example:
140 mg/dL ÷ 18 = 7.8 mmol/L
L — Label the Unit
Always write the unit beside the number.
Good example: 110 mg/dL or 6.1 mmol/L
Unclear example: 110 or 6.1
The number alone is not enough.
E — Explain the Timing
Write when the reading was taken.
Useful timing labels include:
- Fasting
- Before breakfast
- Before lunch
- Before dinner
- 1 hour after eating
- 2 hours after eating
- Before bed
- Random
This helps you avoid comparing readings that were taken in completely different situations.
A — Add Context
Blood sugar numbers are more useful when they are connected to real life.
You might add notes such as:
- “Large rice meal”
- “Walked after dinner”
- “Poor sleep”
- “Stressful day”
- “Sick”
- “Skipped breakfast”
- “Late-night snack”
- “New medication schedule”
These notes may help you and your healthcare professional see possible patterns.
R — Review Patterns
Instead of reacting to every single number, review your readings over time. You might ask yourself:
- Are fasting readings often higher than expected?
- Do certain meals lead to bigger rises?
- Does walking after meals seem to help?
- Are readings different after poor sleep?
- Are weekend patterns different from weekday patterns?
This kind of pattern-based tracking is often more useful than looking at isolated readings. Once you have tracked your numbers for a few weeks, you can even use a glucose to A1C calculator to understand your long-term trends
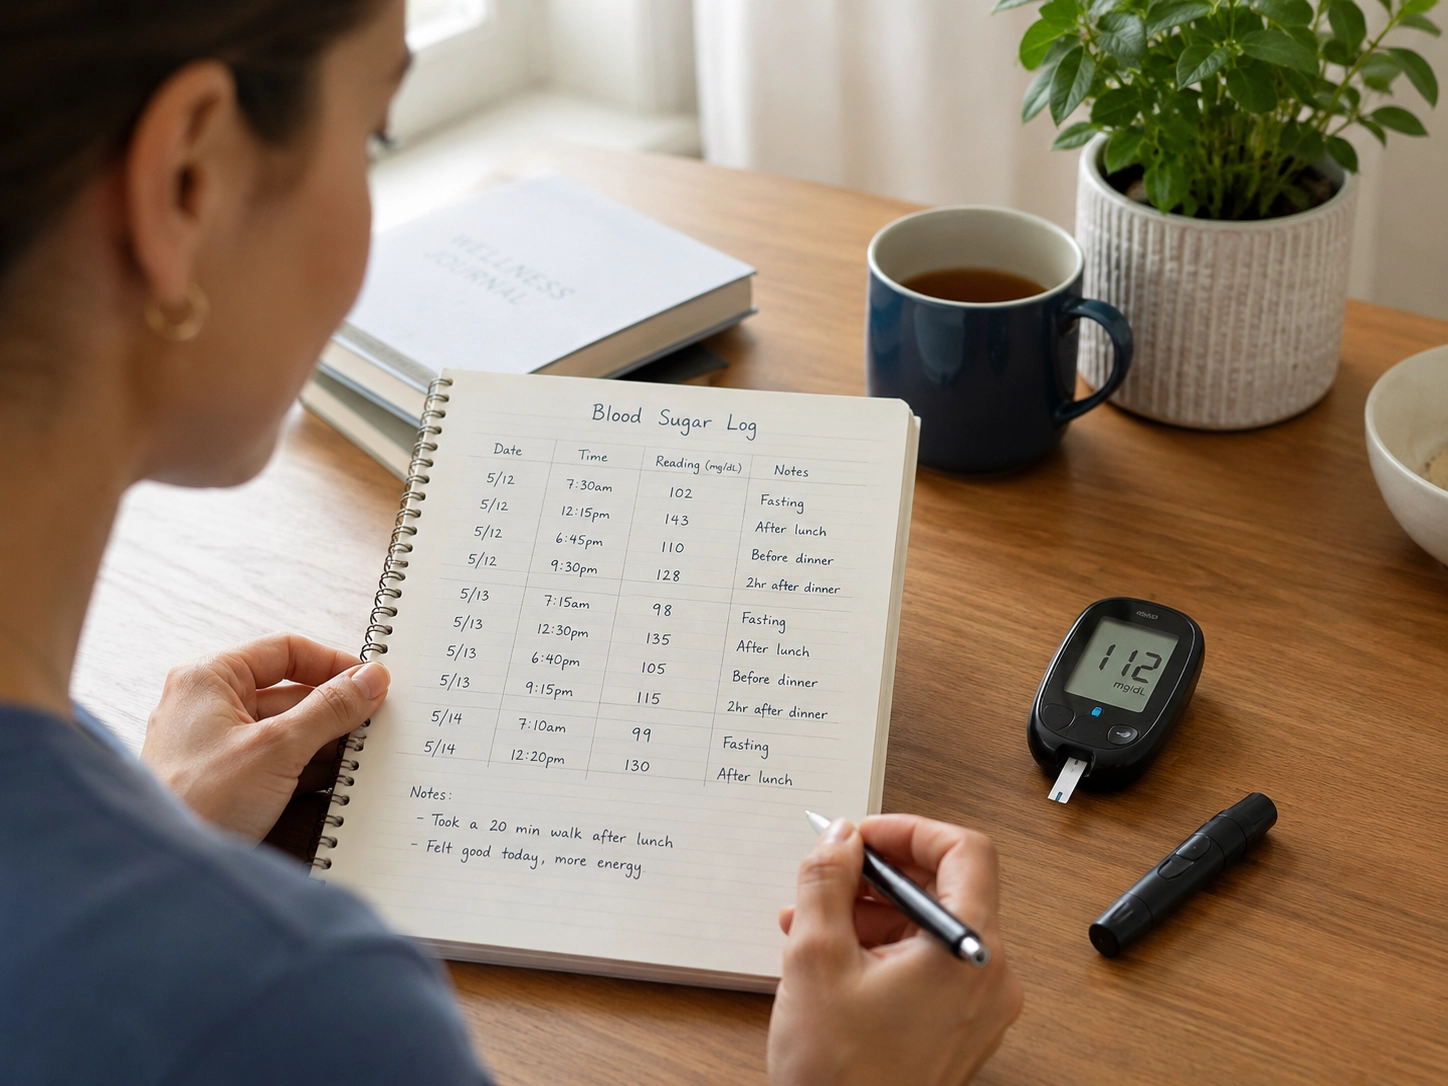
Simple Example: Turning Numbers Into Useful Information
Here is a basic example of how two people might use the same conversion chart differently.
Example 1: Maria Reads an International Article
Maria’s glucose meter uses mg/dL. She reads an article that discusses 7.8 mmol/L after meals.
At first, she does not know whether 7.8 sounds high or low. She checks the conversion:
7.8 × 18 = 140 mg/dL
Now she understands the number in the unit she normally uses. She does not use that number to diagnose herself, but it helps her understand the article more clearly.
Example 2: Daniel Uses a Blood Sugar App
Daniel’s meter shows mmol/L, but his app is set to mg/dL. He enters 6.4 into the app without changing the unit setting.
Later, the log becomes confusing because the app treats the number as 6.4 mg/dL, which is not what he meant.
The mistake was not the reading itself. The mistake was mixing the number and the unit.
A better approach would be to either change the app setting or convert the reading:
6.4 mmol/L × 18 = 115 mg/dL
When to Talk to a Healthcare Professional
A blood sugar conversion chart can help you understand units, but it cannot interpret your personal health situation.
Consider talking with a healthcare professional if:
- Your readings are repeatedly higher or lower than expected
- You feel symptoms that concern you
- You are pregnant
- You use insulin or glucose-lowering medication
- You are unsure how to interpret fasting or post-meal readings
- Your home meter and lab results seem very different
- You are making major changes to your diet, activity, or medication routine
- You feel anxious or confused about your numbers
It is also helpful to bring a clear log with units, timing, and context. This gives your healthcare professional better information than isolated numbers alone.
Practical Takeaway
A blood sugar conversion chart is a simple tool, but it can make glucose monitoring much easier to understand.
Remember:
- mg/dL ÷ 18 = mmol/L
- mmol/L × 18 = mg/dL
- Always label the unit
- Record timing and context
- Look for patterns, not just one reading
- Do not use a conversion chart as a diagnosis or treatment guide
The goal is not to obsess over every number. The goal is to understand your readings clearly enough to track them, discuss them, and make informed daily choices with appropriate medical support when needed.
FAQ
What is a blood sugar conversion chart?
A blood sugar conversion chart shows the same glucose values in both common units: mg/dL and mmol/L. It helps you understand readings from different meters, lab reports, articles, or apps.
How do I convert blood sugar from mg/dL to mmol/L?
Divide the mg/dL number by 18.
Example:
108 mg/dL ÷ 18 = 6.0 mmol/L
How do I convert blood sugar from mmol/L to mg/dL?
Multiply the mmol/L number by 18.
Example:
7.0 mmol/L × 18 = 126 mg/dL
Is 100 mg/dL the same as 5.6 mmol/L?
Yes, approximately. The exact calculation is:
100 ÷ 18 = 5.55 mmol/L
This is usually rounded to 5.6 mmol/L.
What is 7.0 mmol/L in mg/dL?
7.0 mmol/L × 18 = 126 mg/dL
So 7.0 mmol/L is about 126 mg/dL.
Why do different countries use different blood sugar units?
Different healthcare systems use different measurement standards. Some countries commonly use mg/dL, while others commonly use mmol/L. This is why conversion can be helpful when reading international health information.
Are converted blood sugar numbers exact?
The formula is consistent, but charts often round numbers to one decimal place for simplicity. Small differences between charts are usually due to rounding.
Can I use this chart for fasting and after-meal readings?
Yes, the chart can convert any glucose number between mg/dL and mmol/L. However, fasting and after-meal readings should be interpreted differently because timing changes the context.
Can a blood sugar conversion chart tell me if I have diabetes?
No. A chart only converts units. It cannot diagnose diabetes, prediabetes, or any other condition. Diagnosis should be made by a qualified healthcare professional using appropriate tests and medical context.
Should I change my diet or medication based on a converted number?
No. Do not change medication or make major health decisions based only on a conversion chart. If you are concerned about your readings, talk with a healthcare professional.
References & Further Reading
The conversion formulas and general information in this guide are cross-referenced with established guidelines from the following organizations:
American Diabetes Association (ADA): Monitoring Your Blood Glucose
Mayo Clinic: Blood sugar testing: Why, when and how
Centers for Disease Control and Prevention (CDC): Manage Blood Sugar
You should also read:
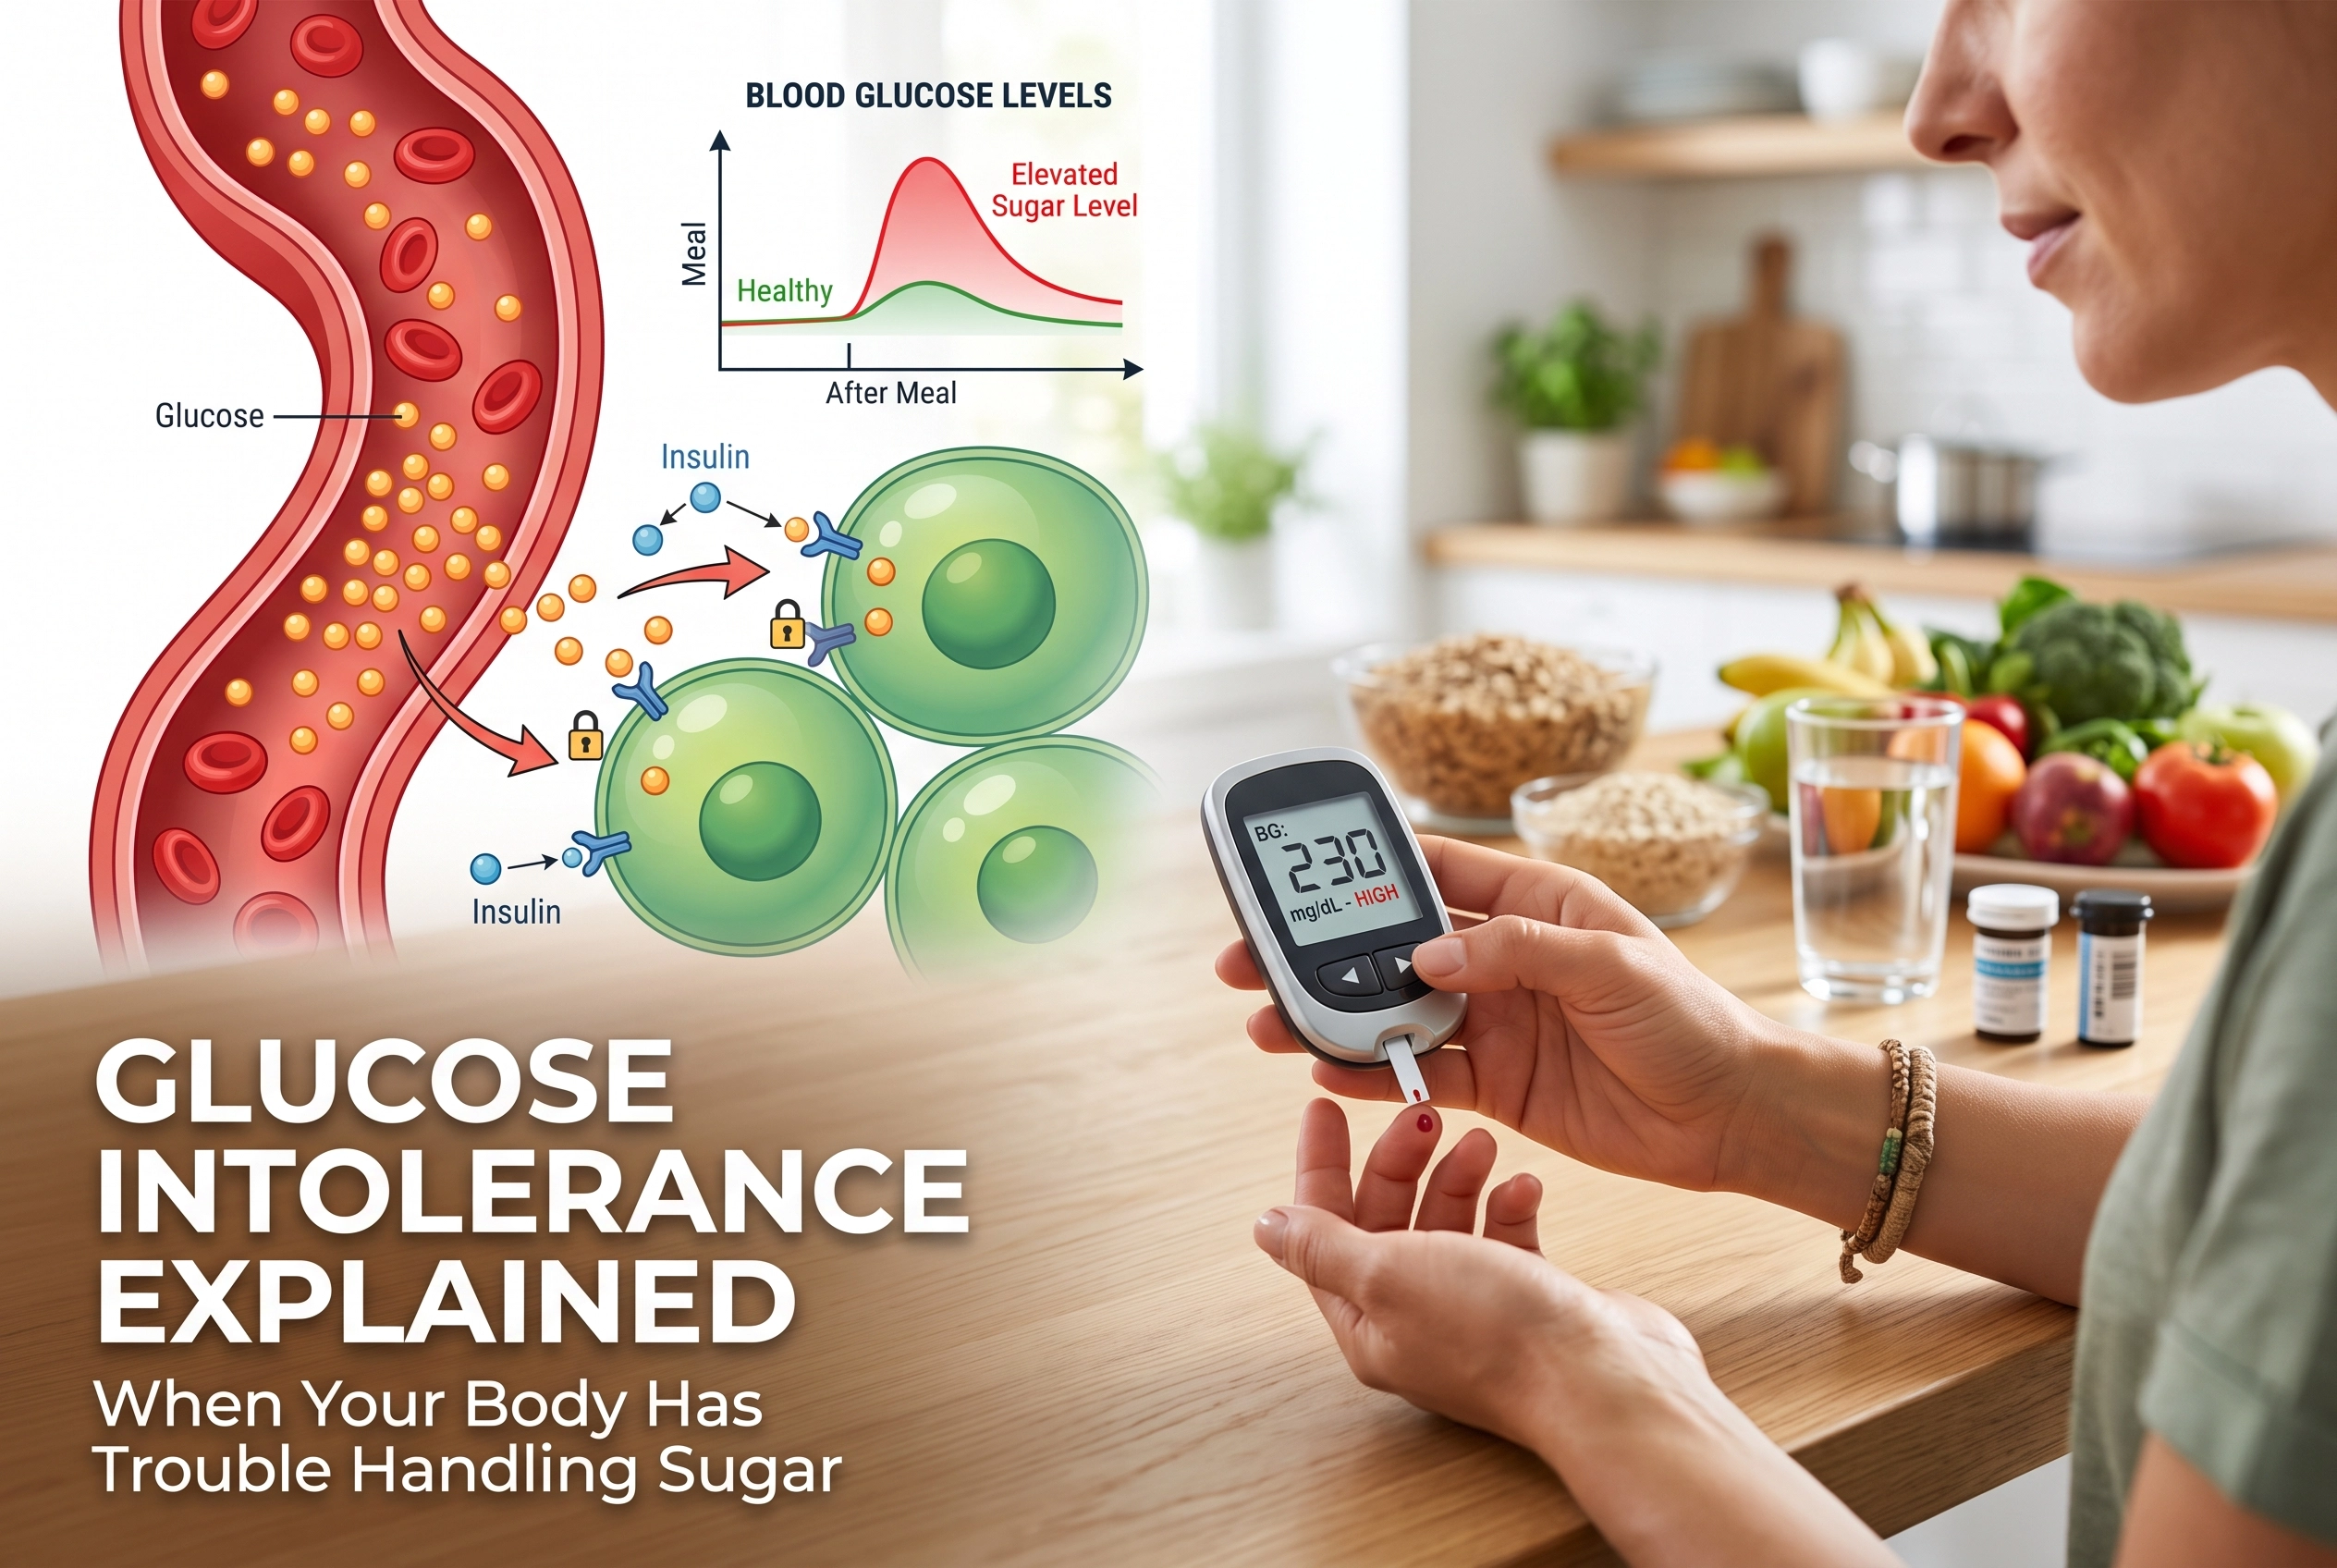
Glucose Intolerance Explained: When Your Body Has Trouble Handling Sugar
Glucose intolerance can sound like a big medical warning, especially if you have seen the term after searching symptoms like tiredness after eating, blood sugar after meals, or prediabetes risk. The phrase can feel confusing because it sits between everyday health language and medical testing…
Continue reading...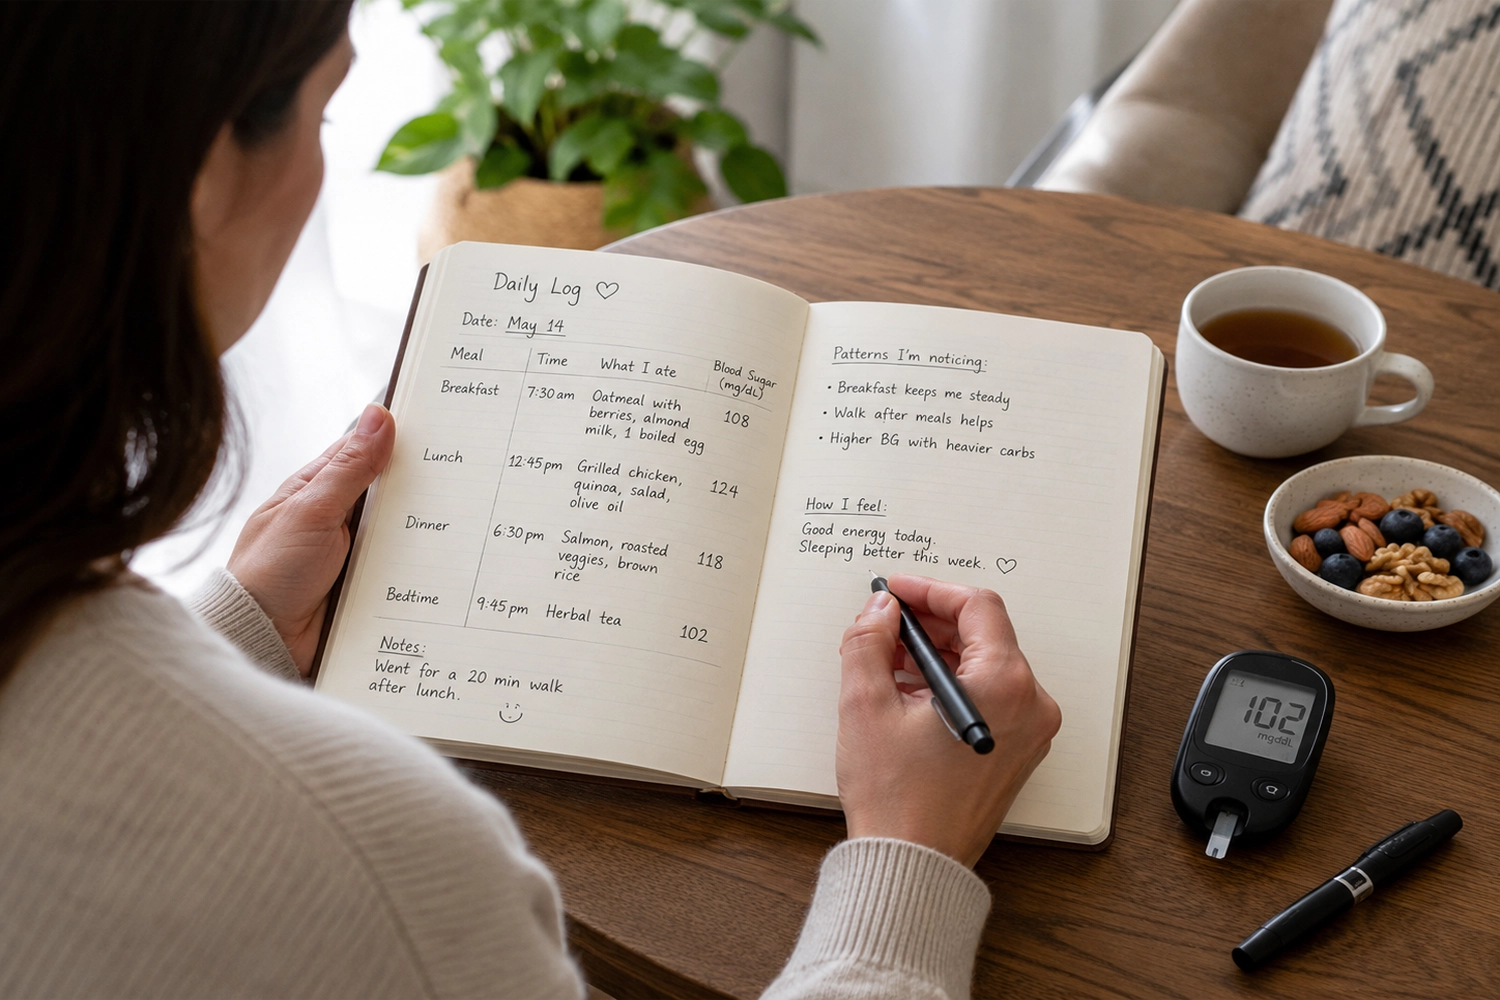
Blood Sugar Support in Real Life: What Actually Helps Day to Day?
If you have ever felt tired after a meal, craved something sweet in the afternoon, or felt confused by blood sugar numbers, the phrase “blood sugar support” can sound both helpful and vague. Some people use it to talk about food choices. Others use it…
Continue reading...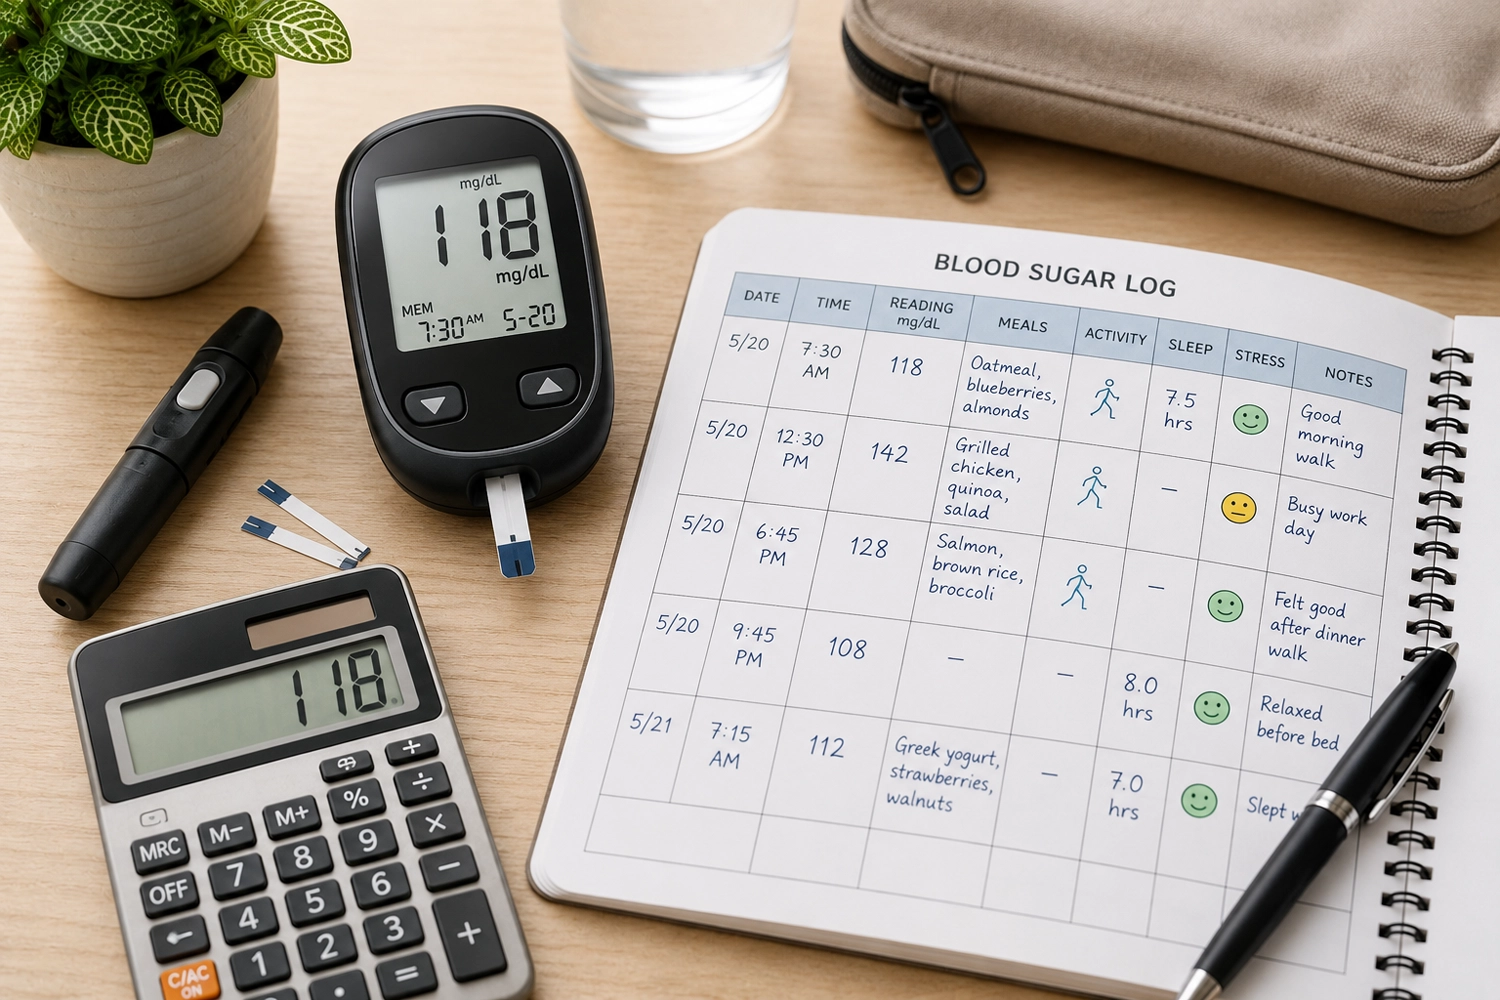
Glucose to A1C Calculator: How to Estimate A1C from Average Blood Sugar
If you track your blood sugar at home, you may already know numbers like 98, 126, 154, or 180 mg/dL. Then you go to a healthcare appointment and hear a different kind of number: your A1C. At first, it can feel like glucose readings and…
Continue reading...