Glucose to A1C Calculator: How to Estimate A1C from Average Blood Sugar
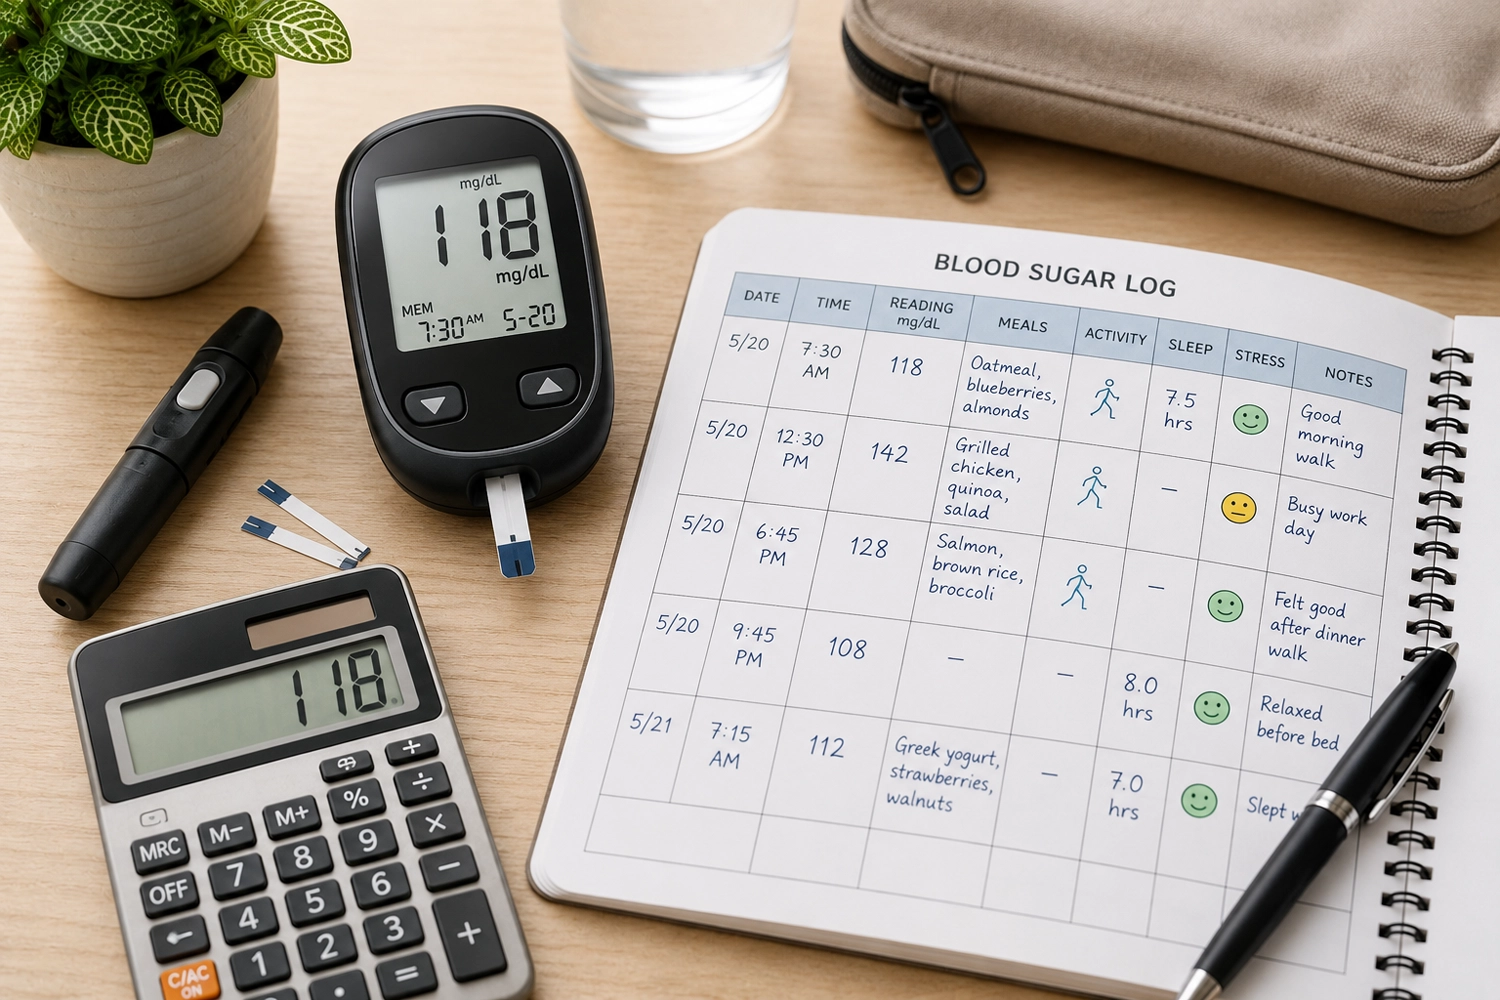
Table of Contents
- What Is A1C in Simple Terms?
- Glucose to A1C Calculator Formula
- Glucose to A1C Conversion Chart
- Why Your Estimated A1C May Not Match Your Lab A1C
- How to Use a Glucose to A1C Calculator in Real Life
- Real-Life Example: Same Average, Different Patterns
- Common Mistakes When Estimating A1C from Glucose
- Practical Checklist: Before You Trust the Estimate
- What This Means for Daily Life
- When to Talk to a Healthcare Professional
- Practical Takeaway
- Health Disclaimer
- FAQ
- What is the formula for converting glucose to A1C?
- Can I calculate A1C from one glucose reading?
- What average glucose equals an A1C of 7%?
- Why is my estimated A1C different from my lab A1C?
- Is fasting glucose enough to estimate A1C?
- Does a CGM give a better A1C estimate?
- Can lifestyle habits affect estimated A1C?
- Should I change my medication based on an estimated A1C?
- Further Reading and Medical References
If you track your blood sugar at home, you may already know numbers like 98, 126, 154, or 180 mg/dL. Then you go to a healthcare appointment and hear a different kind of number: your A1C.
At first, it can feel like glucose readings and A1C results are speaking two different languages. One is measured in mg/dL. The other is shown as a percentage. One may come from a finger-prick meter or continuous glucose monitor. The other usually comes from a lab test.
A glucose to A1C calculator helps translate your average glucose into an estimated A1C. This can make your blood sugar data easier to understand, especially if you are trying to follow trends over time.
But there is one important point: a calculator is only as useful as the number you put into it. One random glucose reading cannot tell you your A1C. A fasting-only average may not show what happens after meals. And an estimated A1C is not the same as a lab result.
This guide explains how the calculation works, why estimates may differ from lab results, and how to use the number in a calm, practical way.
What Is A1C in Simple Terms?
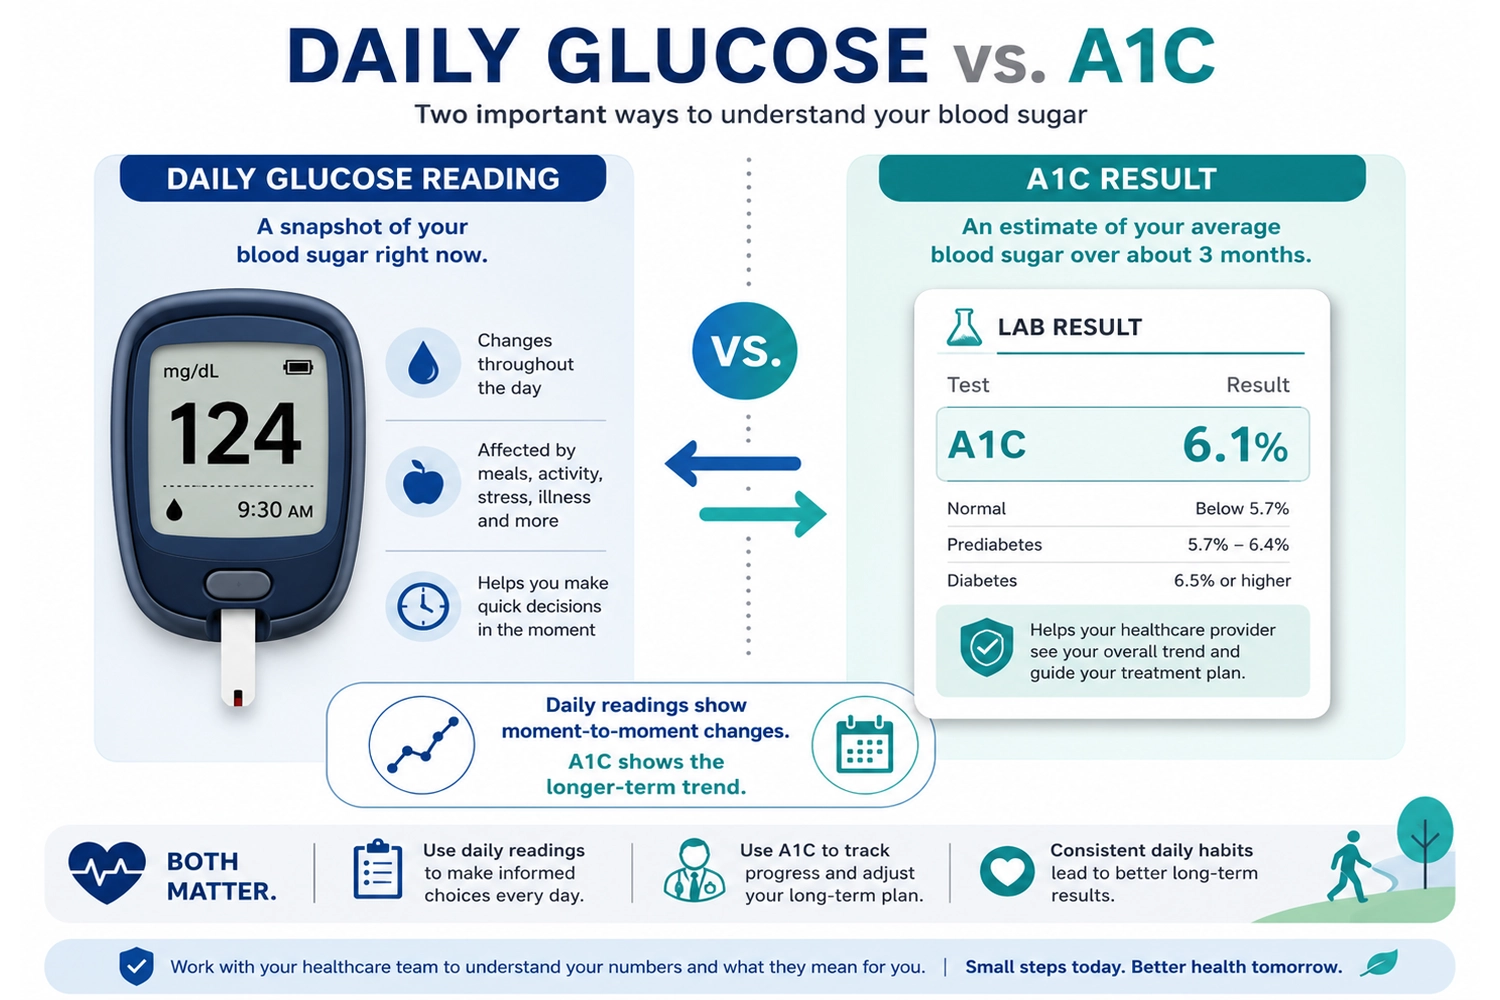
A1C is a blood test that gives a picture of your average blood sugar over roughly the past two to three months.
In simple terms, some glucose in your blood attaches to hemoglobin, a protein in red blood cells. The A1C test measures the percentage of hemoglobin that has glucose attached to it.
That is why A1C is reported as a percentage. For example, an A1C of 6.0% or 7.0% is not the same kind of number as a glucose reading of 126 mg/dL or 154 mg/dL. They are related, but they are not measured the same way.
A1C vs. a Finger-Prick Glucose Reading
A finger-prick glucose reading shows what your blood sugar is at one moment.
For example:
- Before breakfast: 112 mg/dL
- Two hours after lunch: 168 mg/dL
- Before bed: 135 mg/dL
Each reading gives useful information, but each one is only a snapshot.
A1C is more like a longer-term summary. A helpful analogy is weather versus climate. One glucose reading is like checking the weather right now. A1C is more like looking at the pattern over a season.
Both can be useful. They simply answer different questions.
Glucose to A1C Calculator Formula
The common formula for estimating A1C from average glucose is:
Estimated A1C = (Average Glucose + 46.7) ÷ 28.7
This uses average glucose in mg/dL.
The reverse formula is:
Estimated Average Glucose = 28.7 × A1C − 46.7
For example, if your average glucose is 154 mg/dL:
154 + 46.7 = 200.7
200.7 ÷ 28.7 = about 7.0
So an average glucose of around 154 mg/dL is often associated with an estimated A1C of about 7.0%.
This does not mean your lab A1C will definitely be 7.0%. It means the average glucose number roughly translates to that A1C estimate.
Glucose to A1C Conversion Chart
Here is a simple conversion chart for common estimated values:
Average Glucose | Estimated A1C |
97 mg/dL | 5.0% |
111 mg/dL | 5.5% |
126 mg/dL | 6.0% |
140 mg/dL | 6.5% |
154 mg/dL | 7.0% |
169 mg/dL | 7.5% |
183 mg/dL | 8.0% |
197 mg/dL | 8.5% |
212 mg/dL | 9.0% |
240 mg/dL | 10.0% |
Use this chart as a rough translation tool, not as a diagnosis. Your actual lab result may be different for several reasons.
Why Your Estimated A1C May Not Match Your Lab A1C
Many people expect their home glucose average and lab A1C to match perfectly. When they do not, it can feel frustrating.
But differences are common. Here are some reasons why.
Your Glucose Average May Be Incomplete
The calculator needs an average glucose number. But not all averages are equally useful.
For example, imagine someone checks only fasting glucose every morning. Their average may look fairly steady. But if they often have high readings after lunch or dinner, those post-meal patterns may not appear in the fasting-only average.
Another person may check mostly when they feel unwell. That average may look higher than usual because it is based on unusual moments, not a normal daily pattern.
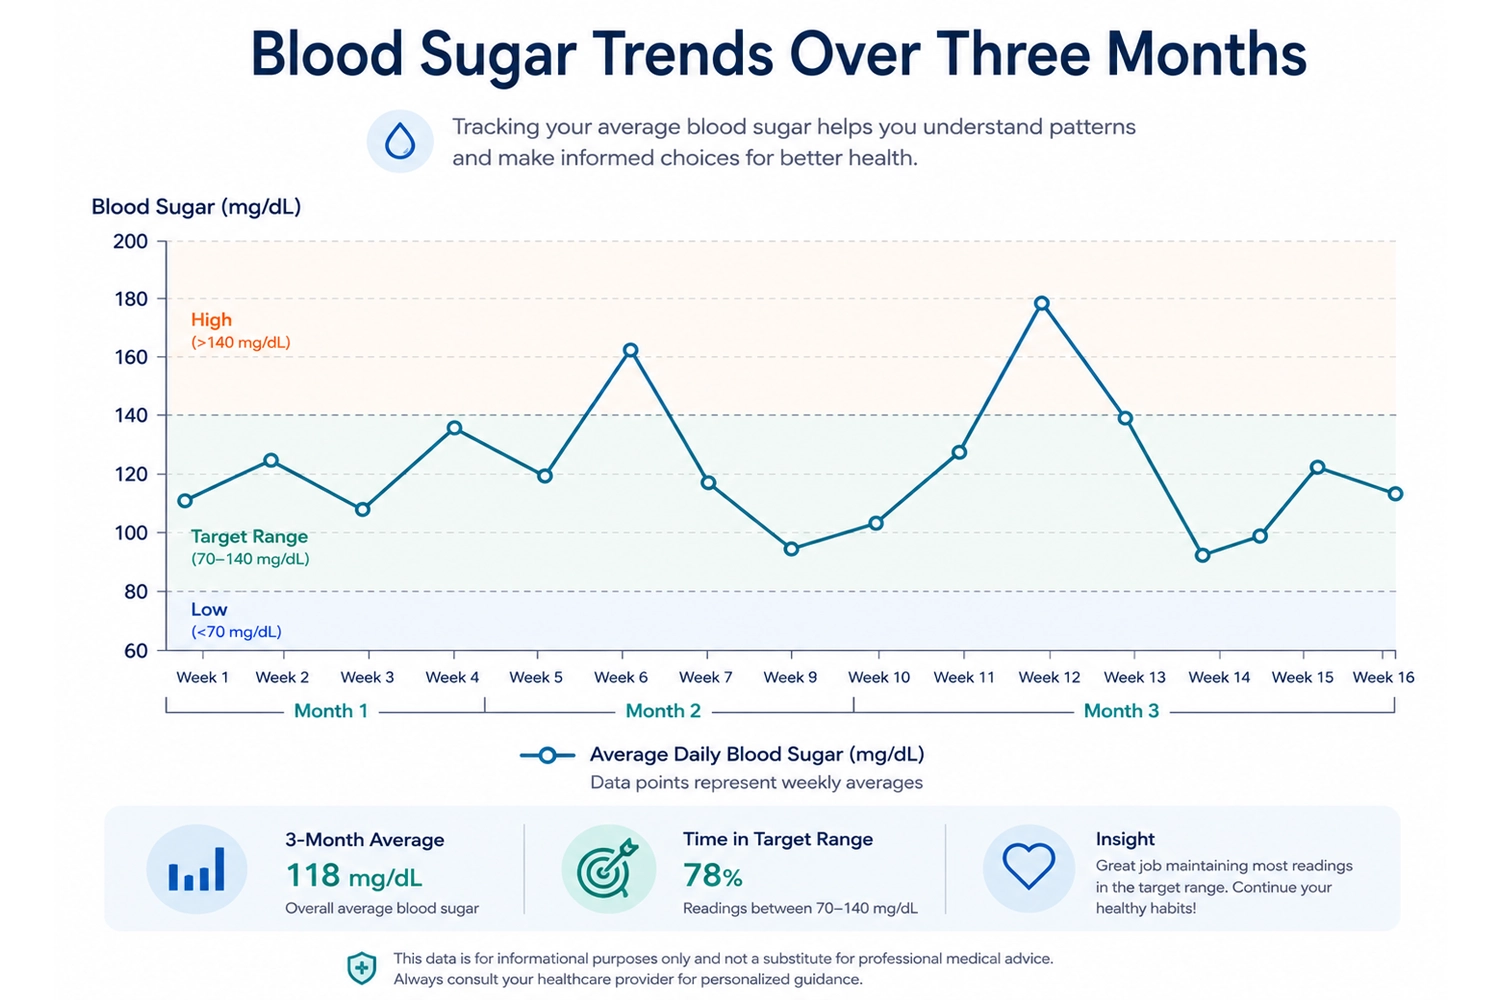
A better average usually comes from more consistent data across different times of day.
A1C Reflects a Longer Time Window
A1C reflects a longer pattern, not just the last few days.
If you recently changed your meals, exercise habits, sleep schedule, or medication plan, your daily glucose readings may change before your A1C fully reflects that change.
For example, someone may start walking after dinner and notice lower evening readings within a week. That is useful feedback. But their A1C may take longer to show the full effect because it reflects a longer-term average.
Fasting Glucose Can Miss After-Meal Spikes
Some people focus only on fasting glucose because it is easy to check in the morning.
Fasting readings are useful, but they do not show the whole story. Some people may have reasonable fasting numbers but higher post-meal readings, especially after meals high in refined carbohydrates or large portions of starch.
This is one reason a glucose to A1C calculator should not be used with just one type of reading unless you understand its limitations.
Some Health Conditions Can Affect A1C Interpretation
A1C is useful, but it is not perfect for every person.
Certain situations may affect how A1C is interpreted, such as anemia, pregnancy, kidney disease, recent blood loss, or some hemoglobin-related conditions. This does not mean A1C is useless. It means unexpected results should be discussed with a healthcare professional.
If your lab A1C and home glucose data seem very different, it is worth asking your clinician what might explain the gap.
How to Use a Glucose to A1C Calculator in Real Life
The calculator is most useful when it helps you understand patterns. It should not make you panic, self-diagnose, or change medication on your own.
Here is a practical way to use it.
Step 1: Know What Average You Are Using
Before entering a number, ask:
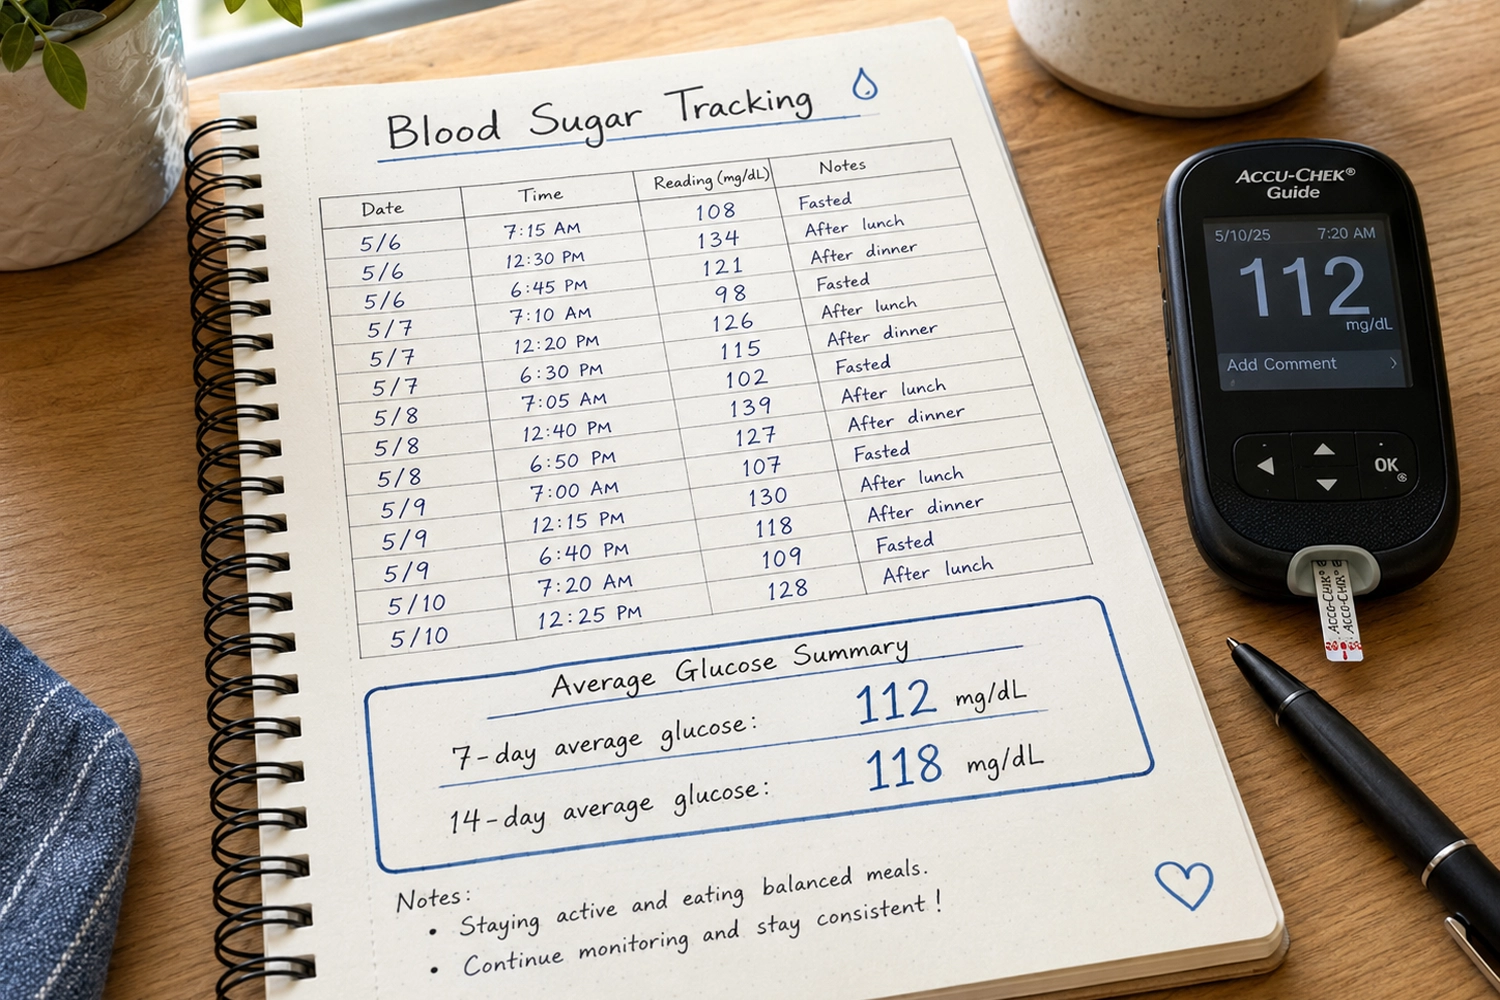
- Is this a 7-day, 14-day, 30-day, or 90-day average?
- Is it fasting glucose only?
- Does it include readings after meals?
- Does it come from a CGM or occasional finger-prick checks?
- Did I check consistently, or only when something felt wrong?
A 90-day average from frequent readings is usually more meaningful than a few random numbers from one week.
Step 2: Treat the Result as an Estimate
An estimated A1C is not a lab test. It is a translation.
Think of it as a way to ask better questions:
- “Is my average moving up or down?”
- “Does this estimate seem close to my last lab result?”
- “Do my daily readings explain my A1C?”
- “Am I missing certain times of day in my tracking?”
The goal is not to get a perfect number. The goal is to understand your trend.
Step 3: Look for Patterns, Not Perfection
Blood sugar is affected by many things, including food, portion size, physical activity, stress, illness, sleep, hydration, and medication.
One high reading does not tell the whole story. One good reading does not tell the whole story either.
More useful questions include:
- Are morning readings usually higher than expected?
- Do certain breakfasts lead to higher readings later?
- Are readings steadier on days with a short walk?
- Do poor sleep nights seem connected with higher glucose?
- Are weekend meals changing the weekly average?
This kind of pattern awareness can support better daily choices without turning tracking into obsession.
Step 4: Compare Estimates with Lab Results
Over time, it may be helpful to compare your estimated A1C with your actual lab A1C.
For example:
- Your 90-day average glucose suggests an estimated A1C of 6.8%.
- Your lab A1C comes back at 7.0%.
That is reasonably close and may help you trust your tracking process.
But if your estimate suggests 6.2% and your lab result is 7.5%, that difference is worth discussing. It may mean your home readings are missing important periods, or there may be another reason your A1C does not match your glucose data.
Real-Life Example: Same Average, Different Patterns
Let’s compare two people.
Person A has steady readings most days:
- Fasting: 115 mg/dL
- After meals: 135–155 mg/dL
- Bedtime: 125 mg/dL
Person B has more ups and downs:
- Fasting: 95 mg/dL
- After breakfast: 220 mg/dL
- Afternoon: 110 mg/dL
- After dinner: 210 mg/dL
Their average glucose might end up looking similar. But their daily patterns are very different.
Person A has a steadier pattern. Person B may have normal-looking fasting glucose but larger post-meal spikes.
This is why a calculator is helpful, but not complete. It translates an average. It does not show when highs and lows happen.
For real life, timing matters. A person who only checks fasting glucose may miss the part of the day where their blood sugar changes the most.
Common Mistakes When Estimating A1C from Glucose
Mistake 1: Using One Reading as an Average
A single glucose reading cannot estimate A1C.
If your glucose is 160 mg/dL after one meal, that does not mean your A1C is based on 160. It simply means your glucose was 160 at that moment.
To estimate A1C, you need an average from many readings.
Mistake 2: Using Only “Good” Readings
Some people may avoid checking after meals because they do not want to see a high number. This is understandable, but it can make the average less useful.
The purpose of tracking is not to judge yourself. It is to learn what is happening.
A higher reading after a certain meal can be useful information. It may help you adjust portion size, add protein or fiber, take a walk, or ask better questions at your next appointment.
Mistake 3: Expecting the Calculator to Match the Lab Exactly
The formula gives an estimate. Your body is not a calculator.
Lab methods, individual biology, red blood cell turnover, health conditions, and the quality of your glucose data can all affect the match between estimated and measured A1C.
A small difference is not always a problem. A large or confusing difference is something to discuss with a healthcare professional.
Mistake 4: Panicking Over One High Number
A high reading can happen for many reasons: a larger meal, less sleep, illness, stress, dehydration, or less activity than usual.
Instead of reacting to one number, look for repeated patterns.
For example, if oatmeal with banana gives you a much higher reading every time, that pattern may be useful. If one unusual restaurant meal gives you a high reading once, that may not represent your normal routine.
Mistake 5: Changing Medication Based on an Estimate
A glucose to A1C calculator should not be used to change medication by yourself.
If you take insulin, diabetes medication, or any medication that can affect glucose, talk with a qualified healthcare professional before making changes. This is especially important if you have frequent lows, very high readings, pregnancy, kidney disease, or other medical conditions.
Practical Checklist: Before You Trust the Estimate
Before relying on an estimated A1C, check these points:
- Am I using average glucose, not one reading?
- Is the number in mg/dL?
- Do I know whether the average covers 7, 14, 30, or 90 days?
- Does my average include different times of day?
- Have I included after-meal readings, not only fasting readings?
- Was I checking consistently?
- Do I understand that this is an estimate, not a diagnosis?
- Have I compared my estimate with a lab A1C?
- Do I have any health condition that may affect A1C interpretation?
- Have I discussed confusing results with a healthcare professional?
This checklist can help you use the calculator more thoughtfully.
What This Means for Daily Life
A glucose to A1C calculator is not just about math. It is about making your blood sugar data easier to understand.
If your average glucose is rising, it may be a signal to look at your recent habits. Have meals changed? Are portions larger? Has sleep been worse? Are you moving less? Are stress levels higher?
If your average glucose is improving, it may show that your daily habits are supporting steadier patterns. Some people may find that balanced meals, more fiber, regular activity, better sleep, or walking after meals can support healthier glucose responses.
But the most helpful mindset is curiosity, not fear.
Instead of asking, “Is this one number bad?” ask:
- “What pattern am I seeing?”
- “What might explain this?”
- “Is this happening often?”
- “What small adjustment can I test safely?”
- “Is this something I should bring to my healthcare professional?”
That approach turns tracking into learning.
When to Talk to a Healthcare Professional

It is a good idea to talk with a healthcare professional if:
- Your estimated A1C is much higher than expected.
- Your lab A1C and home glucose average do not seem to match.
- Your readings are often very high or very low.
- You have symptoms such as unusual thirst, frequent urination, fatigue, blurred vision, or unexplained weight changes.
- You are pregnant or planning pregnancy.
- You have anemia, kidney disease, or another condition that may affect A1C interpretation.
- You are considering medication changes.
- You feel anxious or overwhelmed by glucose tracking.
Blood sugar data can be helpful, but you do not have to interpret everything alone.
Practical Takeaway
A glucose to A1C calculator can help you understand how your average glucose may relate to an estimated A1C. The basic formula is simple, but the meaning depends on your data.
The most important thing is to use a real average, not one reading. A fasting-only average may miss after-meal patterns. A short-term average may not match a three-month lab result. And an estimated A1C should never replace medical advice or lab testing.
Use the calculator as a trend tool. Look for patterns. Compare estimates with lab results. Bring confusing numbers to a healthcare professional. That is a safer and more useful approach than trying to judge your health from one number.
Health Disclaimer
This article is for general educational purposes only and is not medical advice. A glucose to A1C calculator can provide an estimate, but it cannot diagnose diabetes, replace lab testing, or replace guidance from a qualified healthcare professional. Always speak with a healthcare professional about personal blood sugar concerns, symptoms, lab results, or medication decisions.
FAQ
What is the formula for converting glucose to A1C?
The common formula is:
Estimated A1C = (Average Glucose + 46.7) ÷ 28.7
This formula uses average glucose in mg/dL. It should be based on multiple readings, not one glucose result.
Can I calculate A1C from one glucose reading?
No. One reading is only a snapshot. A1C reflects a longer-term average pattern, usually over roughly two to three months.
For example, a single post-meal reading of 180 mg/dL does not mean your A1C is based on 180. You need an average from many readings.
What average glucose equals an A1C of 7%?
An A1C of 7.0% is commonly associated with an estimated average glucose of about 154 mg/dL.
This is an estimate. Your actual lab A1C may be slightly different.
Why is my estimated A1C different from my lab A1C?
Your estimate may differ from your lab A1C because your glucose average may be incomplete, your readings may not cover the same time period, or your home data may miss after-meal spikes.
Some health conditions can also affect A1C interpretation. If the difference is large or confusing, ask a healthcare professional.
Is fasting glucose enough to estimate A1C?
Fasting glucose can be useful, but it is usually not enough to estimate A1C accurately. It may miss what happens after meals, during the evening, or overnight.
A more useful average includes readings from different times of day.
Does a CGM give a better A1C estimate?
A continuous glucose monitor may provide a more complete picture than occasional finger-prick checks because it collects many readings throughout the day and night.
However, CGM-based estimates are still estimates. They should be interpreted alongside lab results and professional guidance.
Can lifestyle habits affect estimated A1C?
For some people, habits such as balanced meals, regular physical activity, sleep, stress management, and consistent routines may support healthier glucose patterns.
Results vary, and lifestyle changes should not be treated as a replacement for medical care.
Should I change my medication based on an estimated A1C?
No. Do not change medication based only on a calculator result. Medication decisions should be made with a qualified healthcare professional.
Further Reading and Medical References
- Nathan, D. M., Kuenen, J., Borg, R., Zheng, H., Schoenfeld, D., & Heine, R. J. (2008). Translating the A1C Assay Into Estimated Average Glucose Values. Diabetes Care, 31(8), 1473–1478. https://doi.org/10.2337/dc08-0545
- National Institute of Diabetes and Digestive and Kidney Diseases. The A1C Test & Diabetes. National Institutes of Health.
- American Diabetes Association. Understanding A1C: What It Measures and Why It Matters. Includes an A1C-to-estimated average glucose conversion calculator and chart.
- Centers for Disease Control and Prevention. A1C Test for Diabetes and Prediabetes.
These references provide supporting information about how A1C is measured, the relationship between A1C and estimated average glucose, the limitations of glucose-to-A1C estimates, and health conditions that may affect A1C accuracy.
You should also read:
Blood Sugar Conversion Chart: How to Understand Your Glucose Numbers in Different Units
Blood sugar numbers can be confusing enough on their own. They become even more confusing when one website shows a reading in mg/dL, your glucose meter uses mmol/L, or a lab report lists a number that looks completely unfamiliar. For example, you may see 100…
Continue reading...
Blood Sugar Support in Real Life: What Actually Helps Day to Day?
If you have ever felt tired after a meal, craved something sweet in the afternoon, or felt confused by blood sugar numbers, the phrase “blood sugar support” can sound both helpful and vague. Some people use it to talk about food choices. Others use it…
Continue reading...
When Managing Blood Sugar Starts to Feel Like a Full-Time Job
There is a particular kind of tiredness that comes from having to think about food all the time. Not just deciding what sounds good for dinner, but wondering what a meal might do to your energy, your cravings, or the numbers you may see later.
Continue reading...